Partnering With TradingView
K.T Bottom Sniper is a short-term mean-reversion indicator built for index charts such as E-mini S&P 500 futures (ES) and US500, and it reads the same way on highly liquid single stocks. It scans for washed-out, fast down-legs where price is most likely to stabilize and bounce, and marks them with a clear LONG triangle. Any market with deep liquidity, tight spreads and clean intraday structure can be traded with it.
View on TradingViewEach component below fires often on its own and is noisy by itself. The real advantage comes from requiring several independent conditions to agree on the same bar — that removes ordinary pullbacks and slow grinds lower, and keeps the signals that look like genuine short-term exhaustion.
Statistical Stretch
Fibonacci deviation bands
A volume-weighted mean of price is wrapped in standard-deviation bands scaled by Fibonacci ratios. Price first has to break below a deep band, meaning it sits statistically far from its recent volume-weighted average and is more likely to revert toward it. Both closing breaks and deeper intrabar flushes count.
Structural Location
Ichimoku cloud
A slowed Ichimoku cloud maps the larger intraday trend structure. A stretch only counts when price has fallen well below the cloud. A band break while price is still inside or near the cloud is usually an ordinary pullback within a trend, not an exhaustion move, so it is ignored.
Downside Momentum
Linear-regression slope
The slope of a rolling linear regression measures how hard price is falling, and the signal demands a steep negative slope. Sharp, emotional drops into the extreme zone tend to stabilize and snap back, while slow grinds lower tend to keep going — the momentum filter screens them out.
A LONG signal appears only when the stretch, location and momentum conditions are all true on the same bar. The exact band levels, cloud settings and thresholds were calibrated by the author on ES and US500 and are built into the script — and because the logic only measures stretch, location and momentum, the same settings carry over to highly liquid single stocks.
Total Realized Gains
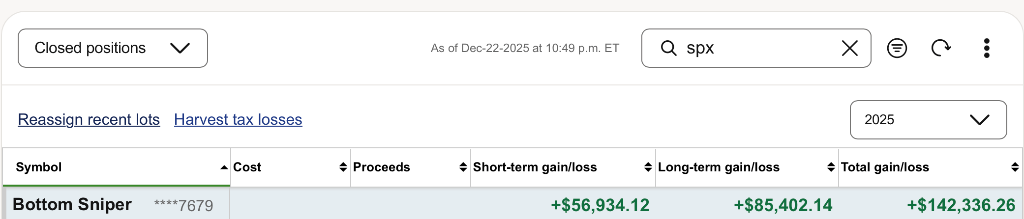
Screenshot from verified brokerage account • All trades executed using SPX Bottom Sniper indicator
Important Disclosure: These results are from a real trader's account and have been verified. Individual results may vary based on trading experience, risk management, account size, and market conditions. Past performance does not guarantee future results. Trading involves substantial risk of loss.
Choose Your License
Simple, transparent pricing. No hidden fees. Cancel anytime.
Monthly
Perfect for trying out the indicator
- Full indicator access
- All trading signals
- Real-time alerts
- Email support
Yearly
Best value for serious traders
- Full indicator access
- All trading signals
- Real-time alerts
- Priority email support
Frequently Asked Questions
Got questions? We've got answers. If you can't find what you're looking for, reach out to our support team.
Questions before you get started?
Send us a message about the indicator, licensing or your subscription and we'll reply by email as soon as we can.